Contrôle des comptes
L’application de contrôle de gestion permet non seulement d’obtenir des informations approfondies sur vos données financières, mais aussi de visualiser les données selon différentes dimensions, de comprendre l’évolution des relations avec les clients et les fournisseurs et d’effectuer des analyses à un niveau très détaillé. En fin de compte, cela peut conduire à une prise de décision mieux informée et à une planification stratégique pour votre entreprise.
Profondeur Clients et Fournisseurs
Obtenez des insights significatifs et basés sur les données concernant la performance de vos clients et fournisseurs. Nos visualisations avancées offrent une présentation stratégique de la répartition géographique de vos clients, ainsi que de la dynamique des coûts et des revenus dans les régions clés. Cela vous fournit des informations essentielles sur les régions à potentiel de croissance et la saturation du marché.
P&L stratégique et contrôle du marché
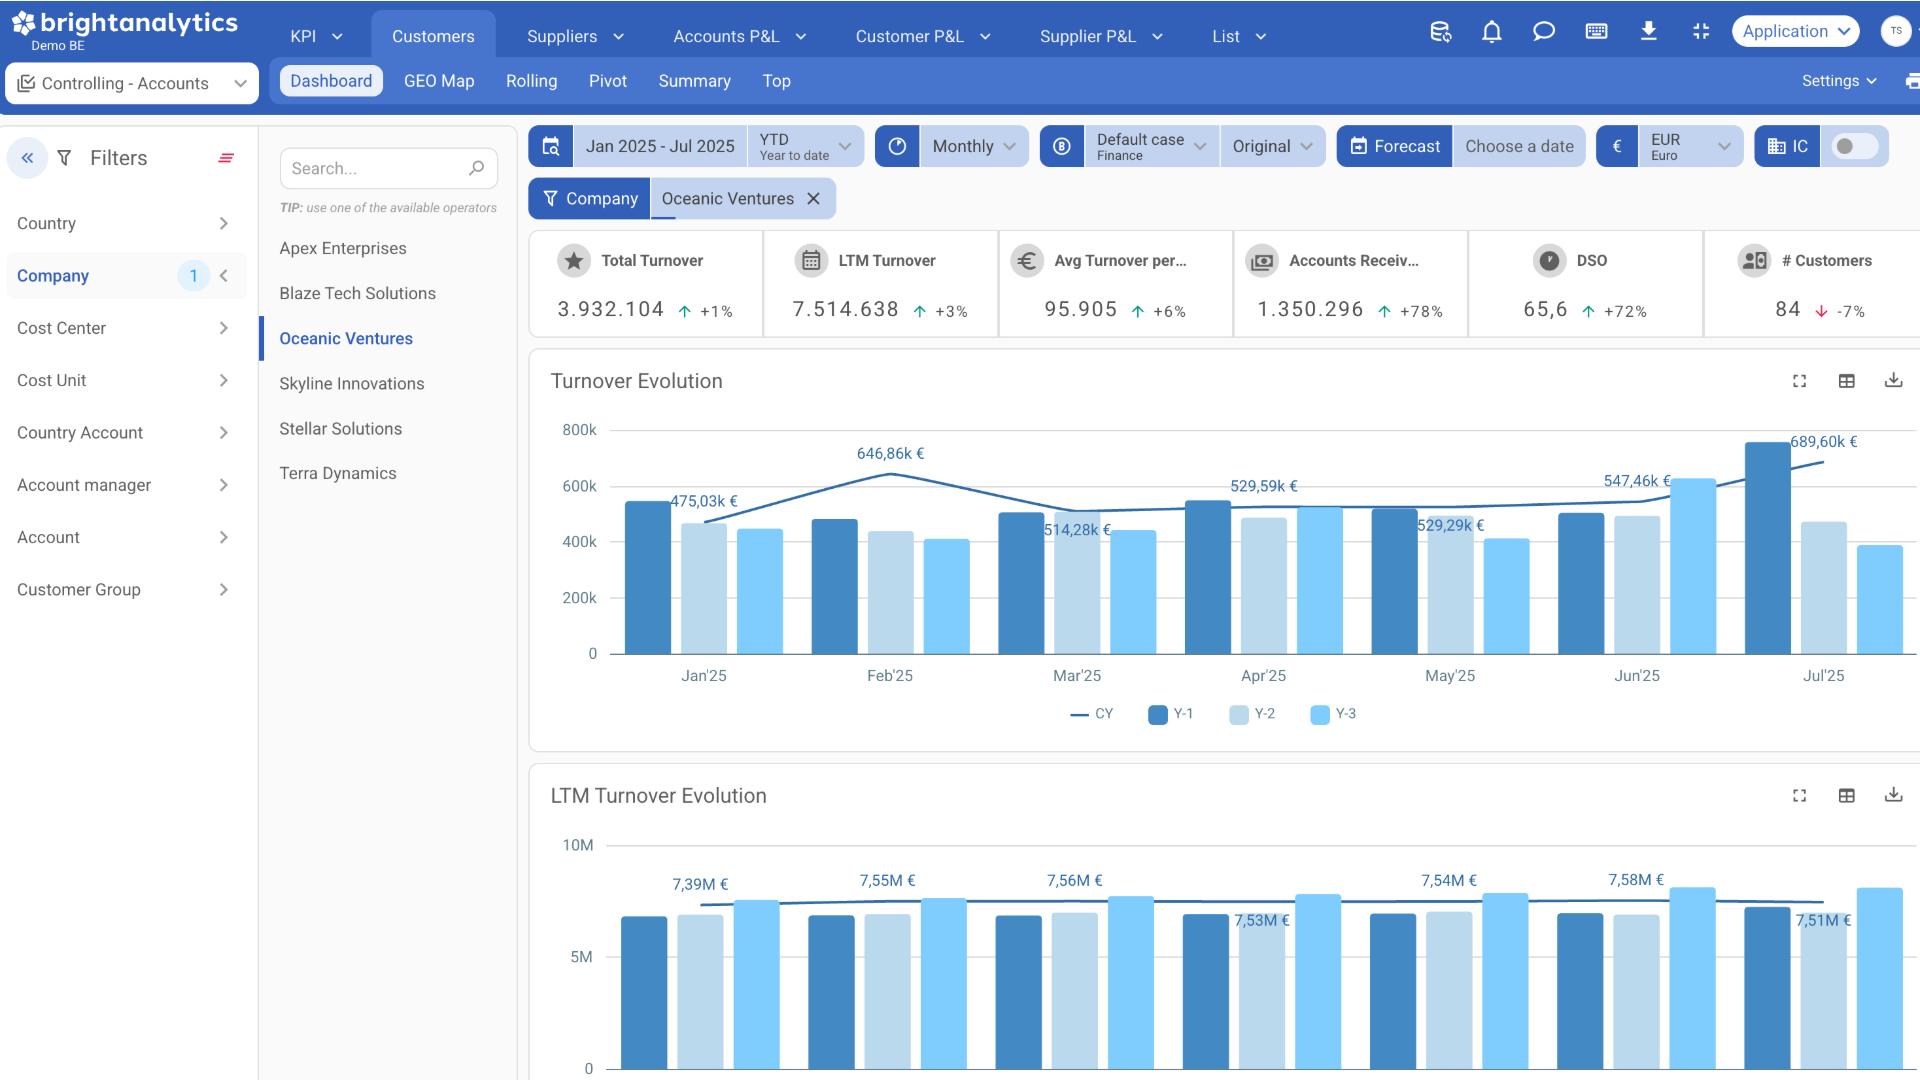
Le module Accounts P&L est la mise à niveau cruciale dont votre P&L a besoin. Il remplace le drill-down vers les comptes généraux par un lien direct vers vos clients ou fournisseurs. Vous voyez ainsi instantanément les chiffres qui comptent, rendant l’analyse de rentabilité plus rapide et plus fiable que jamais. Avec une présentation entièrement centrée sur les entités commerciales, vous pouvez comparer rapidement les performances sur différentes périodes et établir des prévisions fiables directement liées à vos relations clés, ce qui permet de prendre des décisions stratégiques plus pertinentes.
Controlling
ICP
Mesurez vos performances à l’aide d’indicateurs de performance clés (KPI) :
- DSO
- DPD
- chiffre d’affaires moyen
- coût par client/fournisseur
- Chiffre d’affaires LTM/YTD
- …
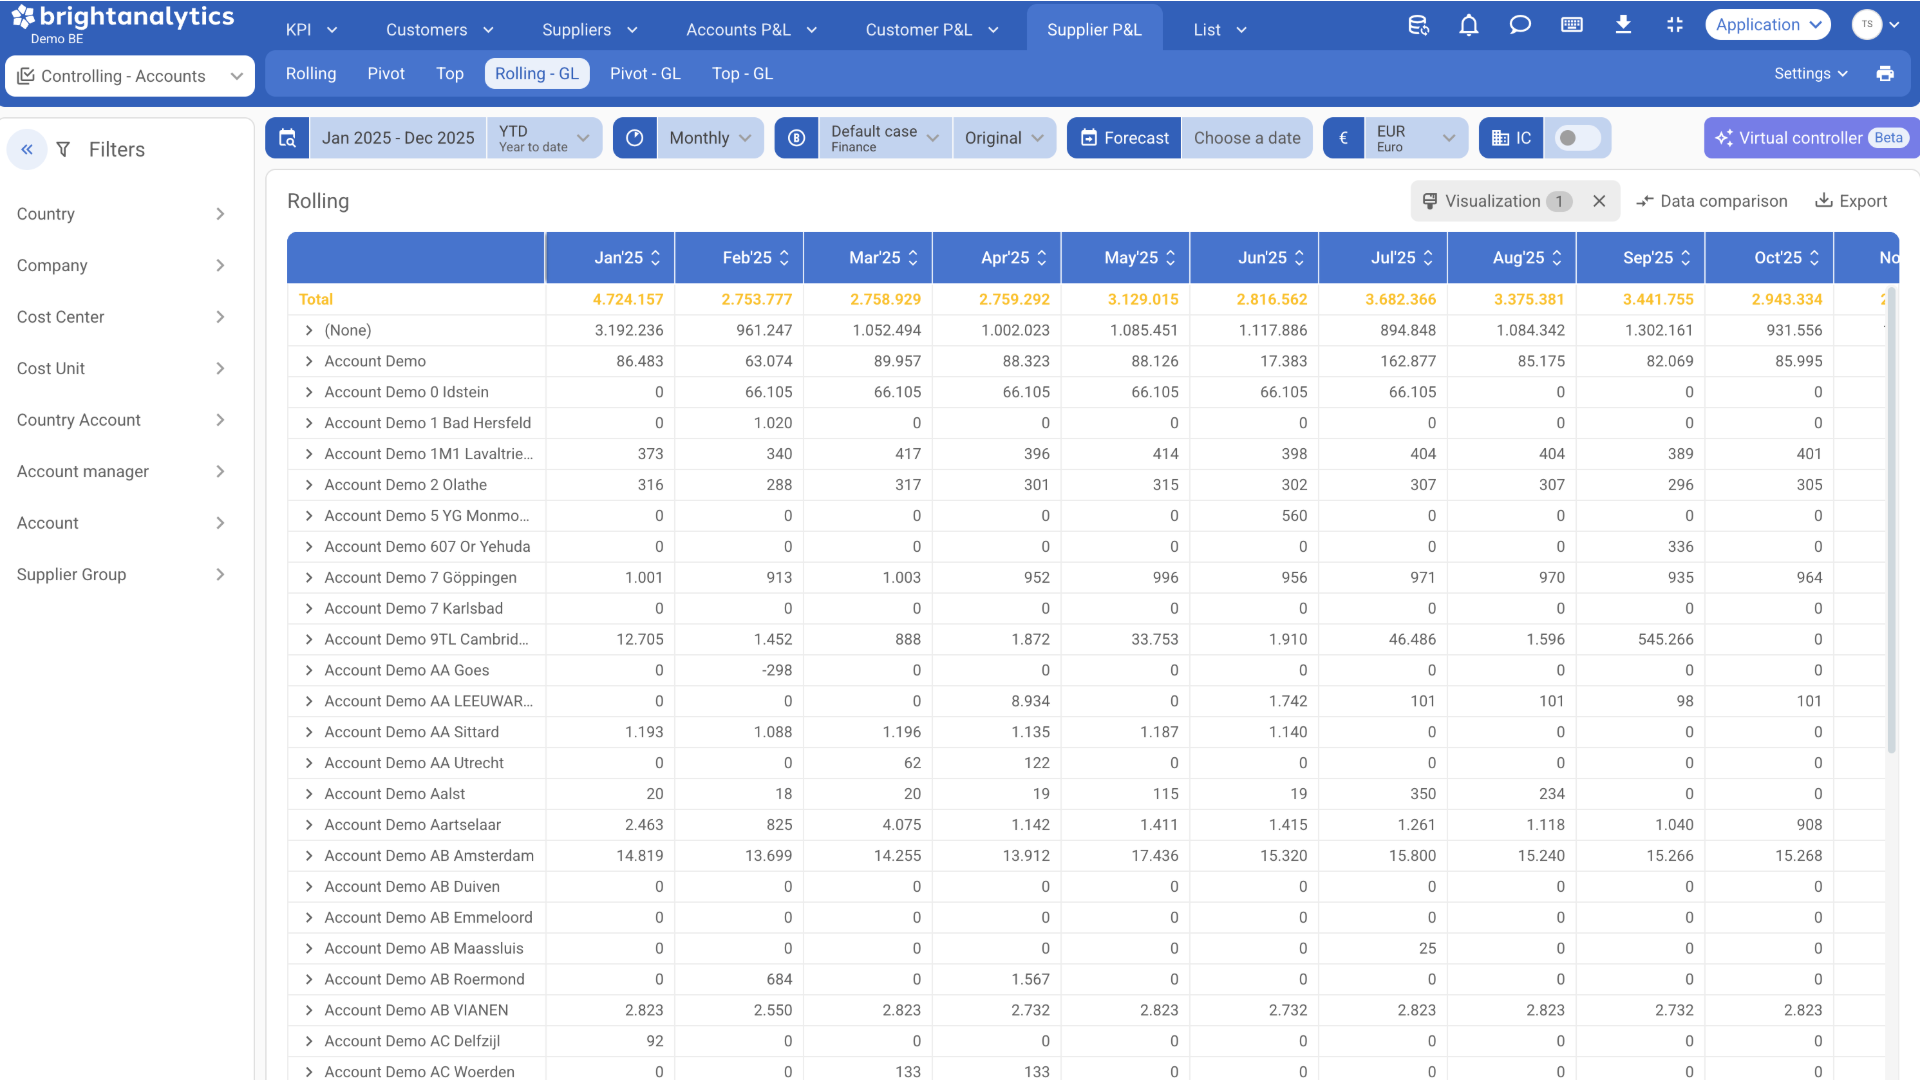
Options de filtrage
L’application propose des filtres flexibles pour l’entreprise, le pays, l’unité de coût, etc. Il permet également un filtrage au niveau des comptes pour identifier les contributions spécifiques aux chiffres.
Carte de chaleur
En utilisant une carte thermique simple, vous pouvez identifier et analyser efficacement les points culminants et les fluctuations de vos données financières. De plus, cet outil facilite la comparaison avec les chiffres de l’année précédente, ce qui vous permet de consulter et de suivre les évolutions dans le temps.
Carte GEO
Vous souhaitez suivre votre chiffre d’affaires ou vos coûts par site ? Notre carte GEO affiche le chiffre d’affaires et les coûts par pays et par code postal, sur la base des données des clients/fournisseurs.
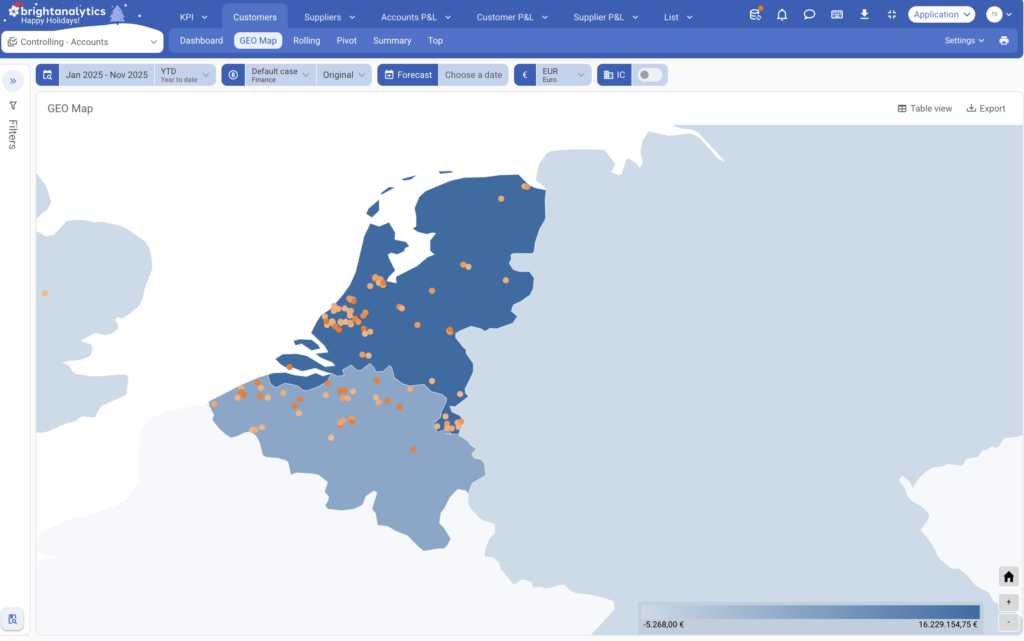
Contrôler les recettes
Comprenez comment vos revenus sont générés : découvrez quels sont les gestionnaires de comptes qui les génèrent, identifiez vos clients clés et utilisez la carte géographique pour voir où ils sont générés.
Budget
Gérez votre budget avec soin. Vérifiez s’il reste de la place dans les budgets prévus et envisagez des ajustements pour optimiser les marges.
Coûts liés aux numéros de documents
Pour les coûts importants, vous pouvez également retracer spécifiquement la facture, le bon de commande, … qui y est lié.

Faisons parler vos données. BrightAnalytics compte plus de 400 intégrations.
- Connectez tous les types d’applications, tant comptables que ERP et CRM.
- La ressource peut être en ligne, sur place ou même une feuille de calcul.
- Un nombre illimité d’applications peuvent être combinées sur la plate-forme.
FAQ
Vous trouverez ci-dessous les réponses aux questions les plus fréquentes concernant notre application de contrôle. Si vous avez une question qui n’est pas abordée ici, n’hésitez pas à nous contacter directement pour obtenir de l’aide.
- BrightAnalytics se connecte-t-il à mon forfait ?
Sur la page https://www.brightanalytics.eu/integraties/ vous trouverez une liste de toutes nos intégrations.
- Mon colis doit-il obligatoirement être un colis Cloud ?
Non, votre paquet ne doit pas nécessairement être un paquet Cloud. BrightAnalytics établit des liens avec des paquets provenant du nuage, du serveur ou même de fichiers Excel.
- Quelle est la différence entre les Customer & Supplier agings et les Controlling Accounts ?
Les agings montrent vos factures ouvertes pour les clients et les fournisseurs, c’est-à-dire les factures qui ont été envoyées mais qui n’ont pas encore été payées.
Les Controlling Accounts montrent quant à elles les revenus et les coûts réellement réalisés, c’est-à-dire les paiements qui ont déjà été reçus ou effectués.
- Qu’est-ce que l’application de contrôle ?
Le contrôle de gestion est une application financière supplémentaire, basée sur les données financières. Il permet d’approfondir les données relatives aux coûts et au chiffre d’affaires et d’établir des rapports sur des dimensions telles que les clients/fournisseurs (groupes), la localisation, … Les dimensions utilisées dans l’application financière et le filtre inter-sociétés sont également ajoutés. Les données relatives aux clients et aux fournisseurs peuvent être classées dans une vue d’ensemble à travers le temps, la structure des profits et pertes ou d’autres dimensions. En nous concentrant sur une partie spécifique du compte de résultat, nous pouvons présenter ces données de manière dynamique dans des graphiques et des tableaux perspicaces jusqu’au niveau des écritures. Enfin, il est également possible de consulter et d’exporter les données au niveau de la ligne de transaction.
- Quelle est la différence entre Controlling Dimensions et Controlling Accounts ?
Controlling (Accounts) dans BrightAnalytics se concentre sur les comptes généraux et les KPIs clés pour suivre la performance financière et les structures de coûts. Si vous êtes principalement intéressé par une vue d’ensemble et une analyse des résultats et des coûts, Controlling (Accounts) fournit les bonnes informations. Si vous souhaitez segmenter les données financières en détail et les analyser selon plusieurs dimensions, par exemple par department, project ou location, alors Controlling Dimensions est l’outil idéal pour des analyses segmentées approfondies et des insights sur la performance.
Voir cette application en action
- Découvrez cette application
- Demandez une démonstration
En laissant votre email, vous pouvez regarder une vidéo sur notre application de contrôle.
En laissant vos coordonnées, vous serez contacté pour une démonstration personnelle expliquant l’application de contrôle.